

Maximizing Profits and Minimizing Risks: Mastering Moving Average Trading Strategies
Trading in the financial markets requires a careful balance between seizing opportunities and protecting your investments from risk. One of the most effective tools for achieving this balance is the use of moving averages (MA) in combination with color-coded indicators. These simple yet powerful visual cues can help traders identify trends, manage uncertainty, and confidently execute trades. In this blog, we’ll explore how moving average strategies can maximize your trading profits while minimizing risks.
What Are Moving Averages?
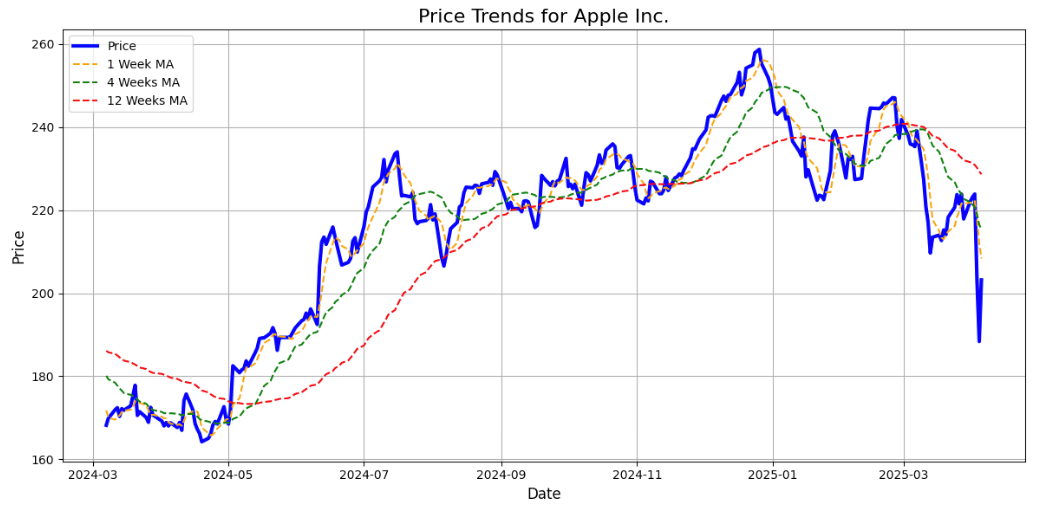
Moving averages are one of the most widely used technical indicators in trading. They smooth out price data over a given period, allowing traders to identify trends without being distracted by daily volatility. Typically, traders use three types of moving averages:
-
1-week MA: Short-term momentum indicator, useful for catching rapid price changes.
-
4-week MA: Medium-term trend indicator, providing a broader view of market sentiment.
-
12-week MA: Long-term directional indicator, revealing overall market behavior.
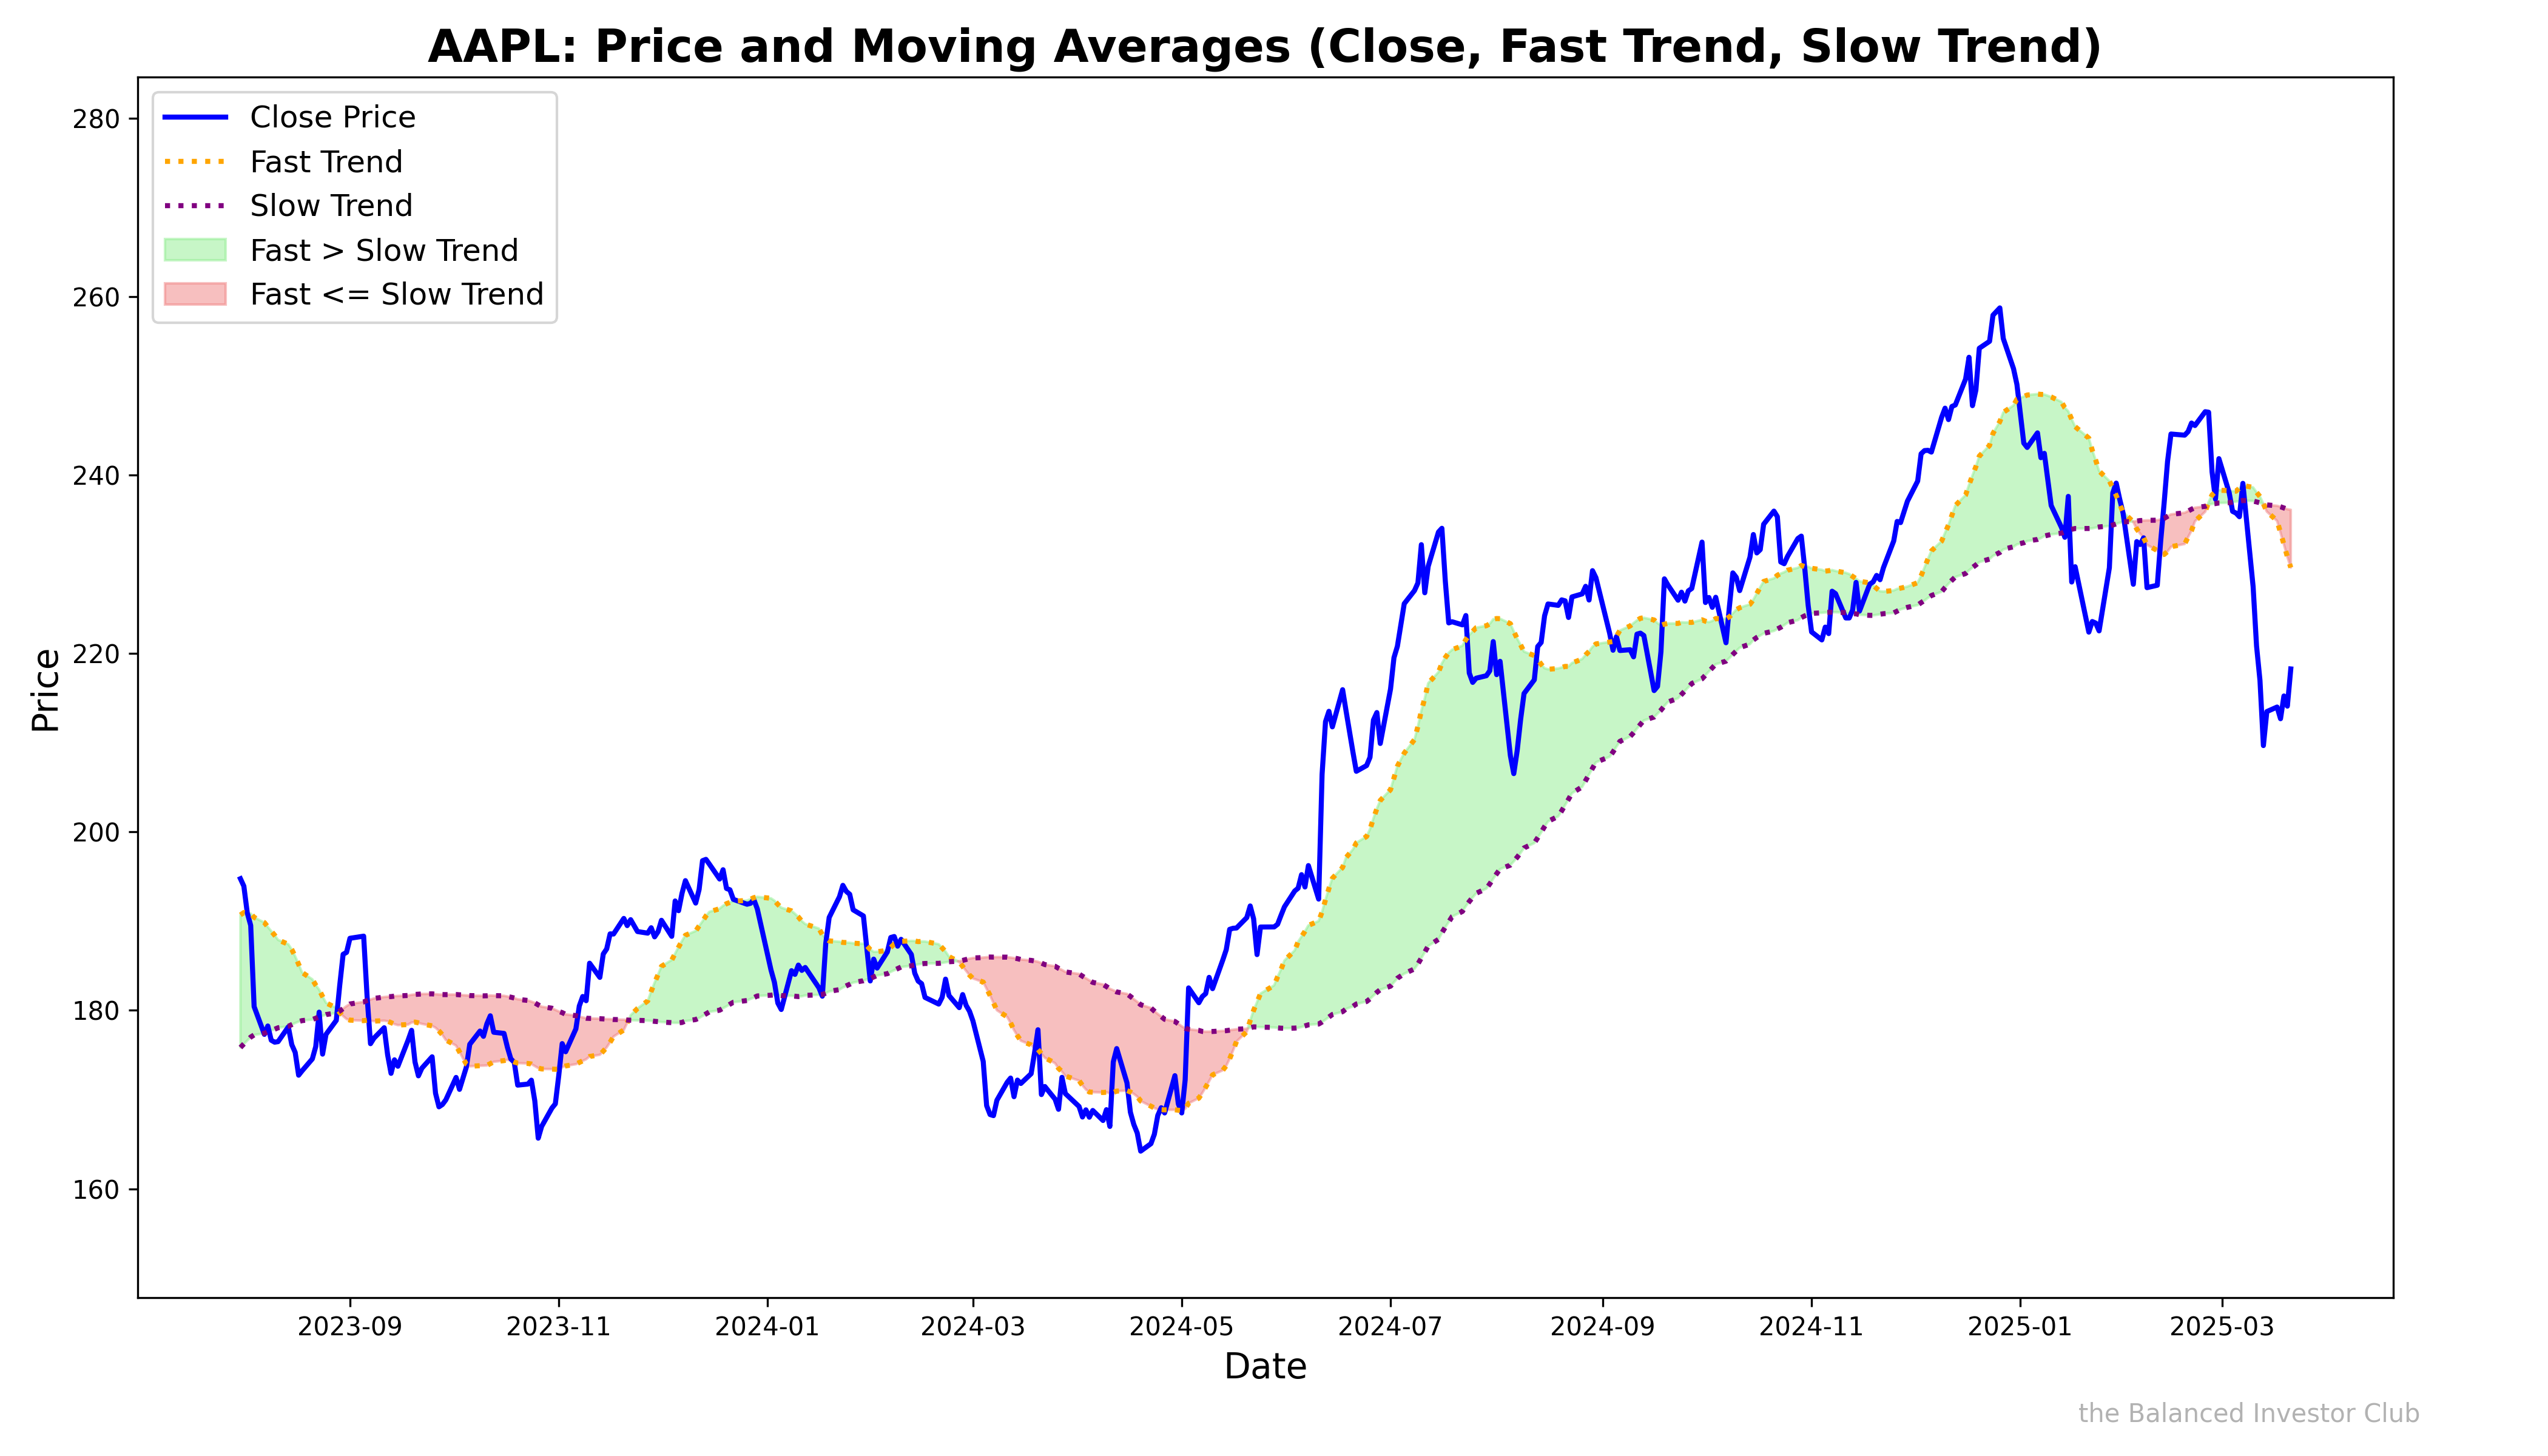
When these moving averages intersect, they create crossover points that signal potential changes in market direction. These crossovers form the foundation of a powerful trading strategy.
Visual Indicators: Green, Red, and Yellow Zones
Color-coded zones make moving averages easier to interpret by visually signaling market conditions:
-
Green Zones: Occur when the 4-week moving average (MA_4W) crosses above the 12-week moving average (MA_12W). These zones indicate bullish trends and present buying opportunities.
-
Red Zones: Appear when the 12-week moving average (MA_12W) crosses above the 4-week moving average (MA_4W). These zones signify bearish trends and are ideal for selling or entering short positions.
-
Yellow Zones: Highlight crossovers between the 1-week moving average (MA_1W) and the 4-week moving average (MA_4W). These zones represent transitional moments in the market, advising caution and adjustments to risk management strategies.
The combination of these zones transforms complex market data into intuitive, actionable insights for traders.

Why Use Moving Average Strategies?
1. Precision Entry and Exit Points
Crossover points provide clear signals for trading decisions:
-
Bullish Entry: Green zones appear when MA_4W crosses MA_12W upward, signaling strong buying momentum.
-
Bearish Exit: Red zones form when MA_12W crosses MA_4W downward, urging traders to close long positions or initiate shorts.
2. Risk Mitigation
Yellow zones act as warning signals during transitional periods in the market. Traders can tighten stop-losses, avoid entering trades, or reduce exposure to volatile conditions.

3. Emotional Discipline
Trading decisions guided by visual indicators reduce impulsive emotional reactions. The color-coded zones ensure consistency and prevent fear or greed from dictating trades.
4. Maximized Opportunities
Both bullish (green) and bearish (red) zones offer opportunities for gains, ensuring traders can profit regardless of market direction.
5. Simplified Decision-Making
The visual clarity of green, red, and yellow zones simplifies analysis, making it easier for traders—novice and experienced alike—to act decisively.
Case Study: Leveraging Crossovers to Optimize Trading
Let’s consider a stock where:
-
4W crosses above 12W (Green Zone): A trader enters a long position at $120, anticipating further upward momentum.
-
1W crosses below 4W (Yellow Zone): The market transitions, prompting the trader to tighten their stop-loss.
-
4W crosses below 12W (Red Zone): A bearish reversal is signaled, leading the trader to exit at $150, securing a $30-per-share profit.
This strategy enables the trader to ride bullish trends while protecting gains during reversals.
How to Implement Moving Average Strategies
-
Learn the Basics:
-
Familiarize yourself with moving averages and their significance in trading.
-
-
Monitor Crossovers:
-
Identify key points where MA_4W crosses MA_12W or MA_1W crosses MA_4W.
-
-
Respond to Visual Zones:
-
Use green and red zones for trading decisions, and yellow zones for risk management adjustments.
-
-
Combine with Other Tools:
-
Enhance accuracy by pairing this strategy with complementary indicators like RSI or MACD.
-
Final Thoughts
A trading strategy built on moving averages and color-coded visuals offers clarity and consistency. It empowers traders to spot opportunities early, manage risks effectively, and make disciplined, data-driven decisions. Whether you’re riding the waves of a bullish trend or avoiding pitfalls in transitional zones, this strategy equips you to navigate the markets confidently.
Want to elevate your trading game? Start mastering moving averages and discover the power of green, red, and yellow zones today!